Top 4 Indicators To Use On Trading View
TradingView is one of the best charting platforms you can use. There are thousands of indicators to choose from, you can even make your own. Choosing what to use can be daunting. Here are 4 of the most popular indicators that you can use to help your trading
Supertrend
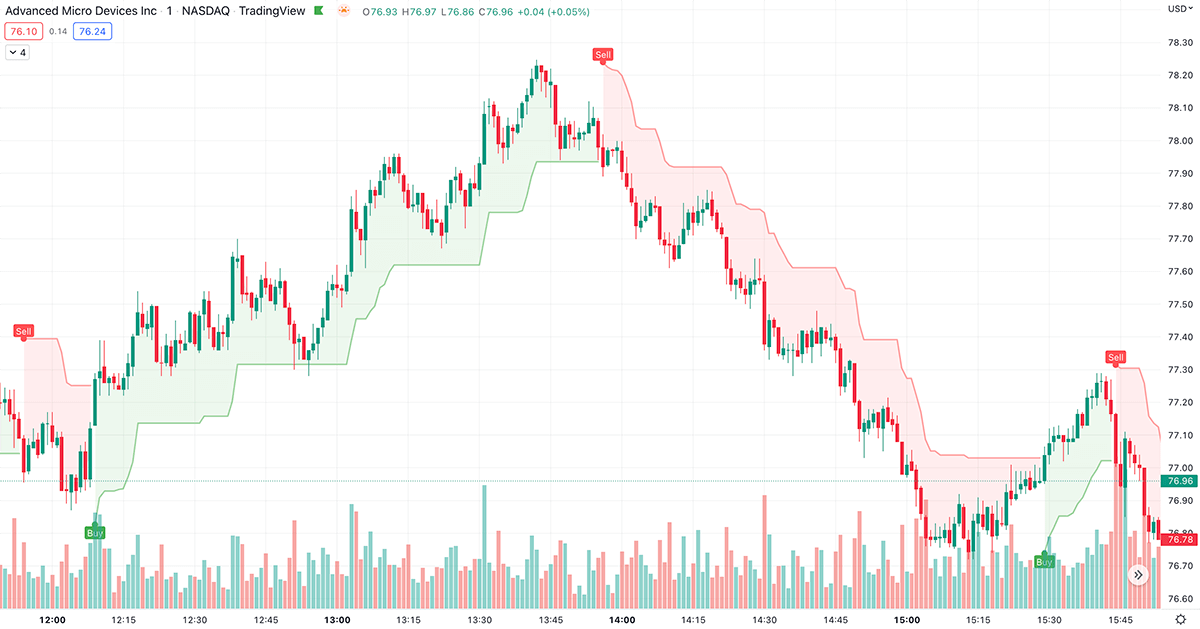
Supertrend is a trend indicator that can give you buy and sell signals. It uses an average true range and a multiplier. Default settings are 10 and a multiplier of 3. This indicator can act as resistance or show a change in the trend. This can be a great intraday indicator to use.
Here is an example of the Supertrend indicator on AMD, you can see where it gives you buy and sell signals and how the price moves with them in the bands.
VWAP (Volume Weighted Average Price)
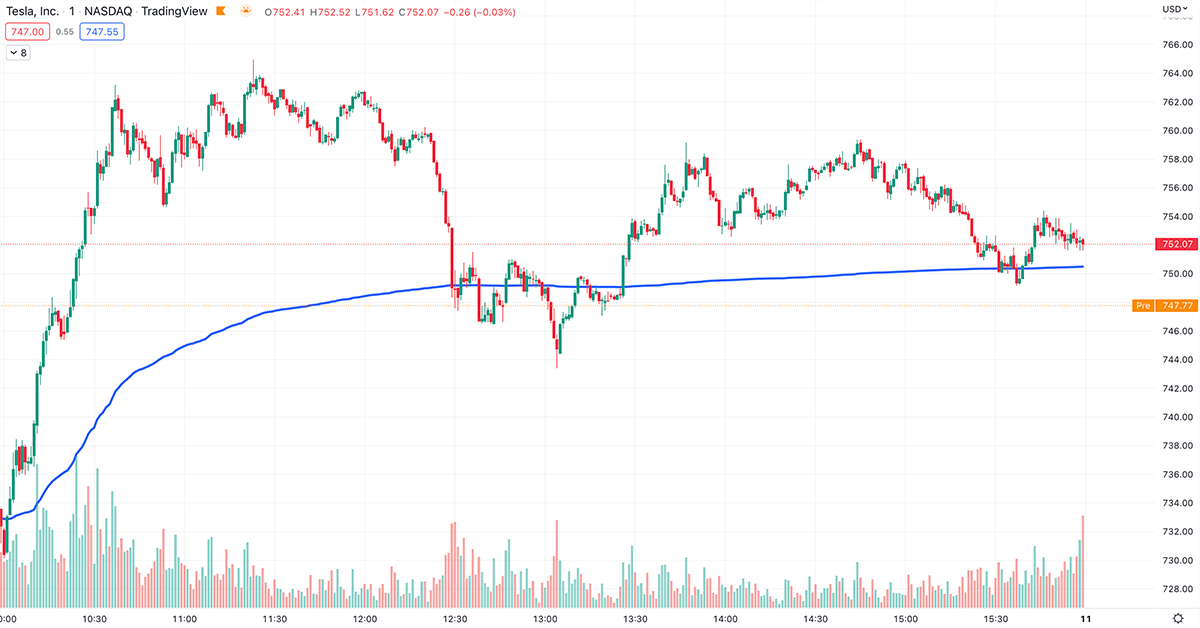
Vwap is a volume indicator to use for intraday trading it is the average of the price weighted by total trading volume. Vwap is calculated for each trading day and starts over the next day. It uses intraday data. Vwap can be used as support and resistance and can also show when the trend is over extended if the price has moved far out from the Vwap line.
Here is an example of VWAP on Tesla stock.
Volume Profile
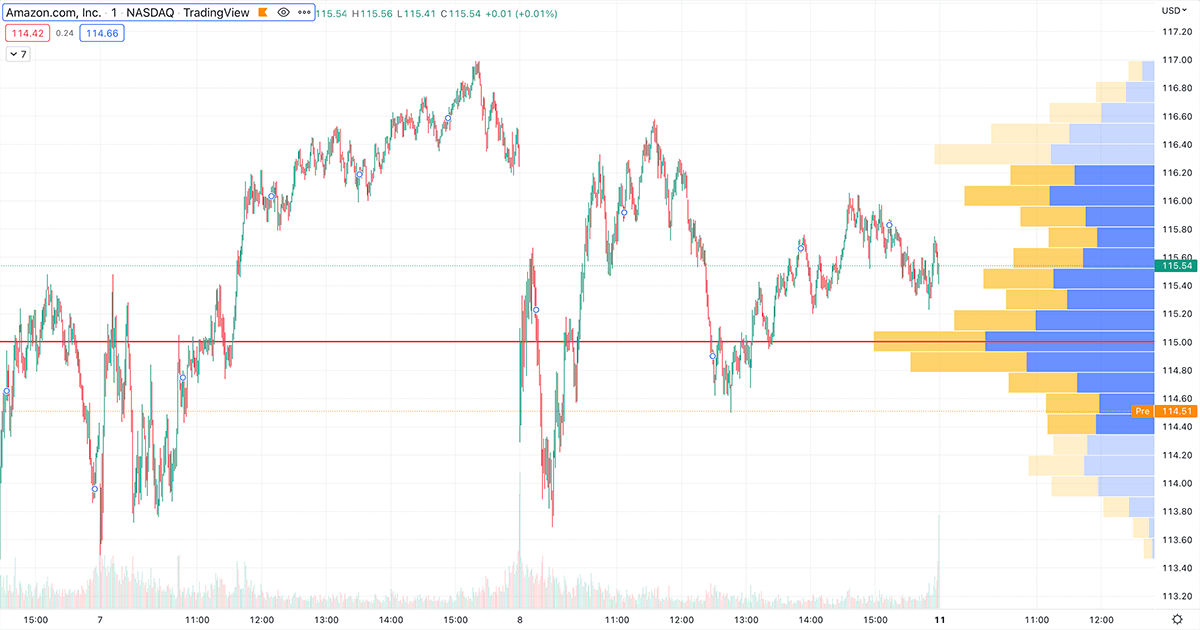
Volume profile is an indicator that will overlay over your chart and show you volume and different price levels so you can see what prices people were placing large trades at. This can be helpful because it allows you to see where certain support or resistance levels are. It will show horizontal bars at important price levels indicating where volume is directly on your chart.
Here is an example of Volume Profile on Amazon stock.
Ichimoku
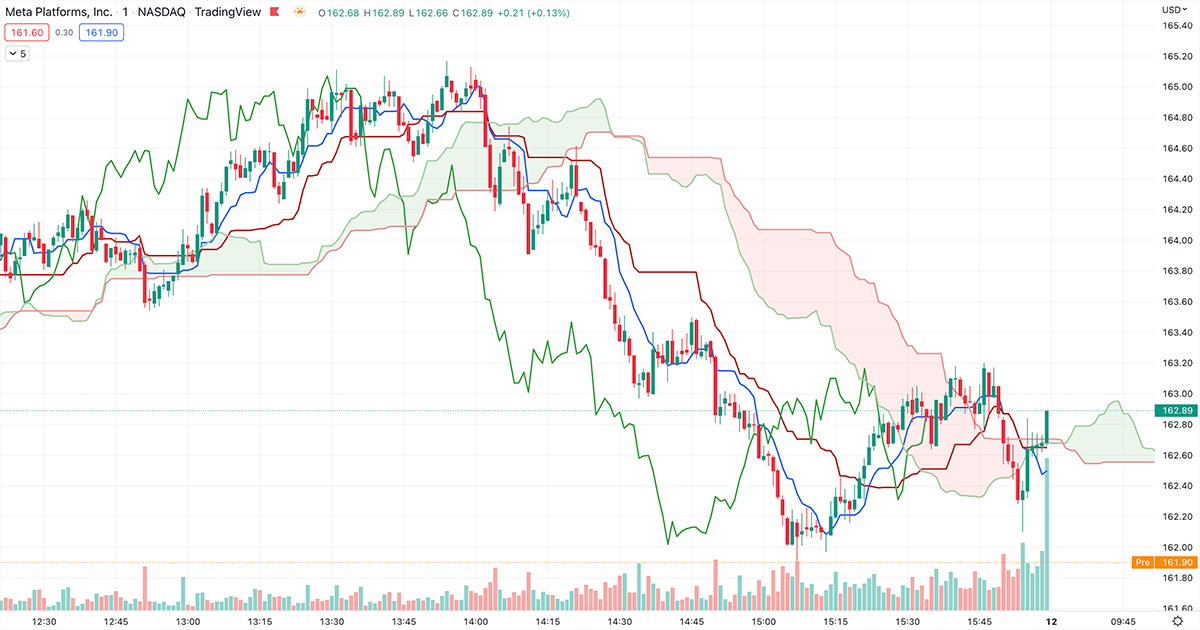
Ichimoku is an indicator that will show you the trend, momentum and volume all at once. It can be a complex indicator with a lot to process.
There are 5 lines
- The Leading Span A (senkou span A)
- Leading Span B (senkou span B)
- Lagging Span (chikou span)
- The Conversion Line (tenkan sen)
- Base Line (kijun sen)
The Senkou Lines form a Cloud that you can use for support and resistance or use to trade breakouts when it breaks above or below the cloud. You can use the tenkan and kijun lines to trade crossovers. There are many ways to use this indicator, and learning how to use it can be proven to be very useful.
Here is an example of a breakout of the Ichimoku Cloud on Meta stock.
Conclusion
Supertrend, VWAP, Volume Profile, and Ichimoku are 4 of the top indicators you can use to develop and incorporate into your trading strategy.