3 Day Trading Candlestick Patterns You Should Know
Candlestick patterns will show you the price movement of a stock or asset. It can give clues to what is happening with the price and whether buyers or sellers are taking control of the price. A pattern can be formed with just one candle or a series of candles. Here are 3 of the most popular.
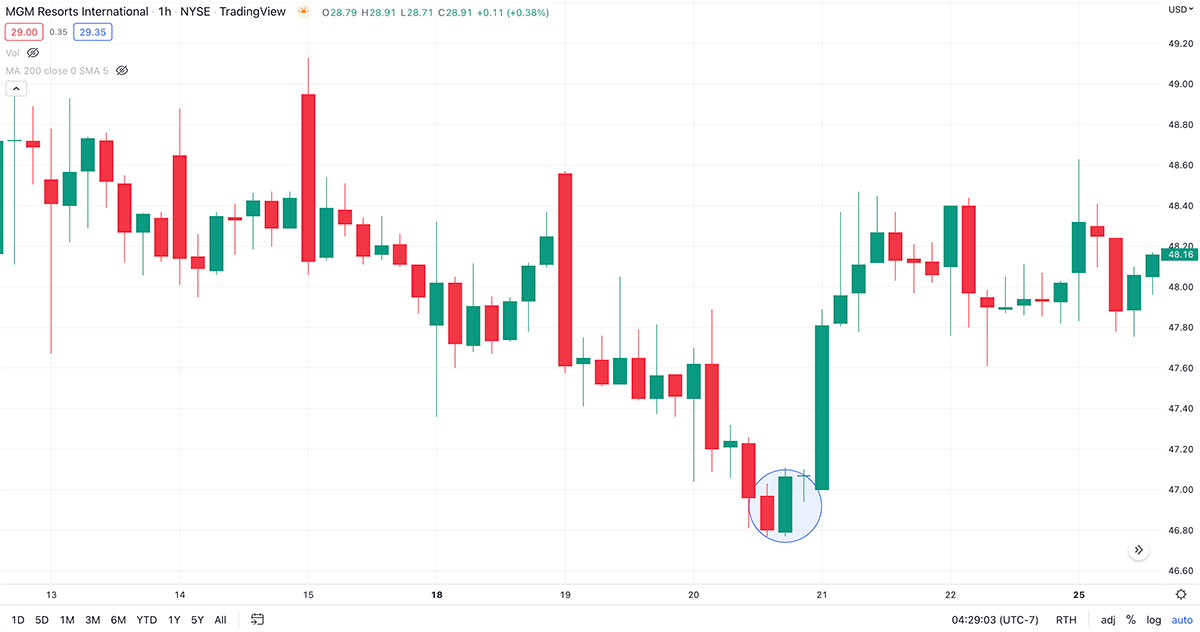
Hammer / Inverse Hammer
A hammer pattern looks exactly how it looks a small body with a long wick at the end of it. It happens at the end of a downtrend while an inverse hammer pattern happens at the end of an uptrend where it can signal a reversal.
Here is an example of a Hammer Pattern.
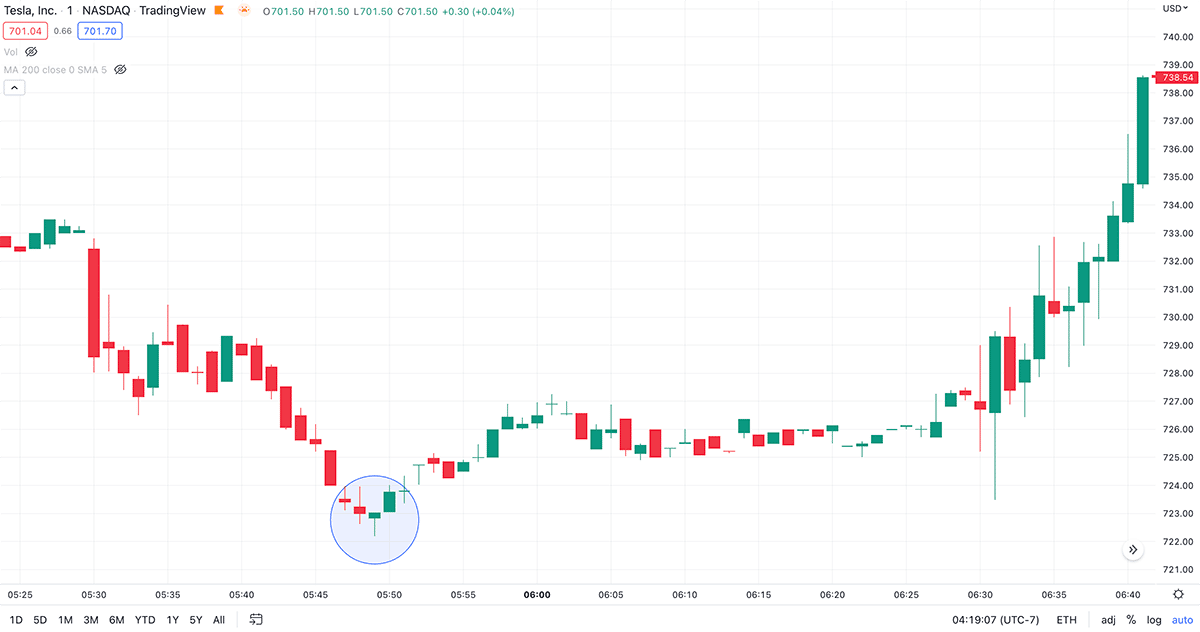
Bullish Engulfing / Bearish Engulfing
A Bullish Engulfing pattern is formed with two candles the first one being a smaller body with longer wicks and then the next candle engulfing the first one with a bigger body and wicks. It happens at the end of a downtrend and signals a reversal. A Bearish Engulfing pattern is the same thing but appears at the end of an uptrend.
Here is an example of a Bullish Engulfing Pattern.
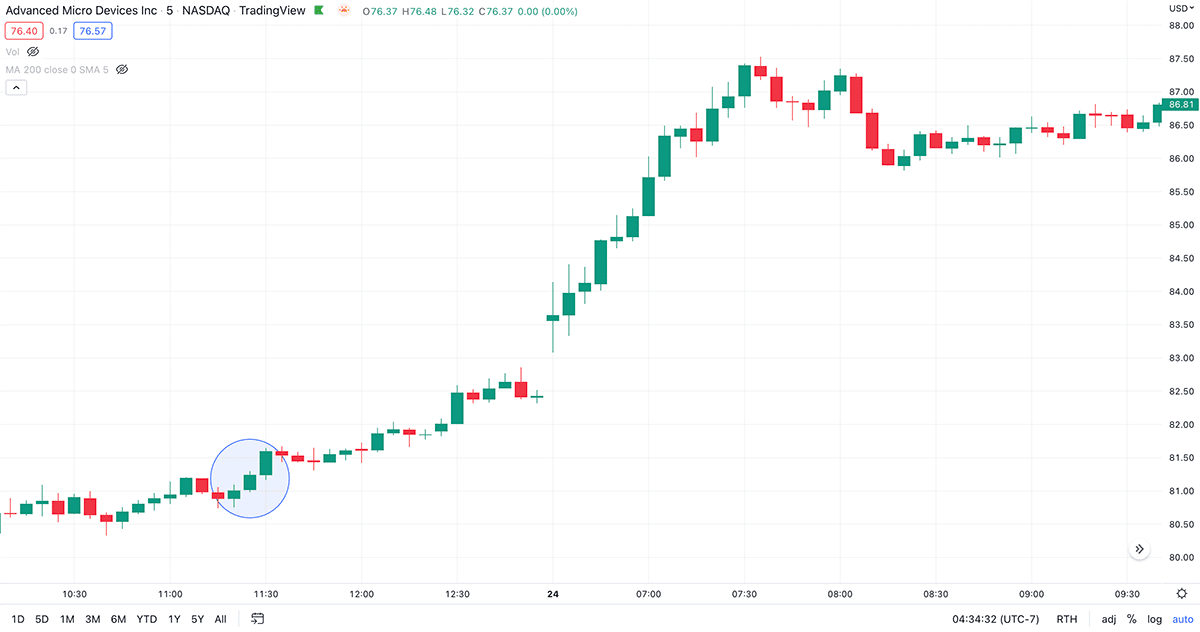
Three White Soldiers / Three Black Crows
The Three White Soldiers is a bullish pattern that can indicates a reversal. It consists of 3 bullish candles each with a higher close than the previous with no gaps between the candles. It can signal strong sentiment in the price of the asset you are trading. The Three Black Crows pattern is the opposite. It is the same pattern but with bearish candles.
Here is an example of a Three White Soldiers Pattern.