How To Trade Using Multiple Time Frames - Guide
Using multiple time frames is something every trader should be doing. It allows you to see the whole picture because if you are just looking at one time frame there is a lot you are missing. You should be using 2 to 3 time frames so you can get a good look at the market and see support and resistance levels and see the general direction of a stock.
What Type Of Trader Are You
First you need to determine if you're a short term trader or a long term trader. If you're a long term trader you might use a 1-hour chart with a 1-day chart since you are using longer time frames. Where as a short term trader might use a 1-minute chart with a 15-minute chart since they are likely scalping small moves.
"Always confirm trades using Multiple Time Frames"
How to Use Multiple Time Frames
Things you can determine from multiple time frames are for example you might be looking at a 1-minute chart and it looks like it's in a downtrend but looking at the 15-minute chart you can see that it's just a pull back to previous lows before potentially bouncing to new highs. These are things you can determine by using multiple time frames.
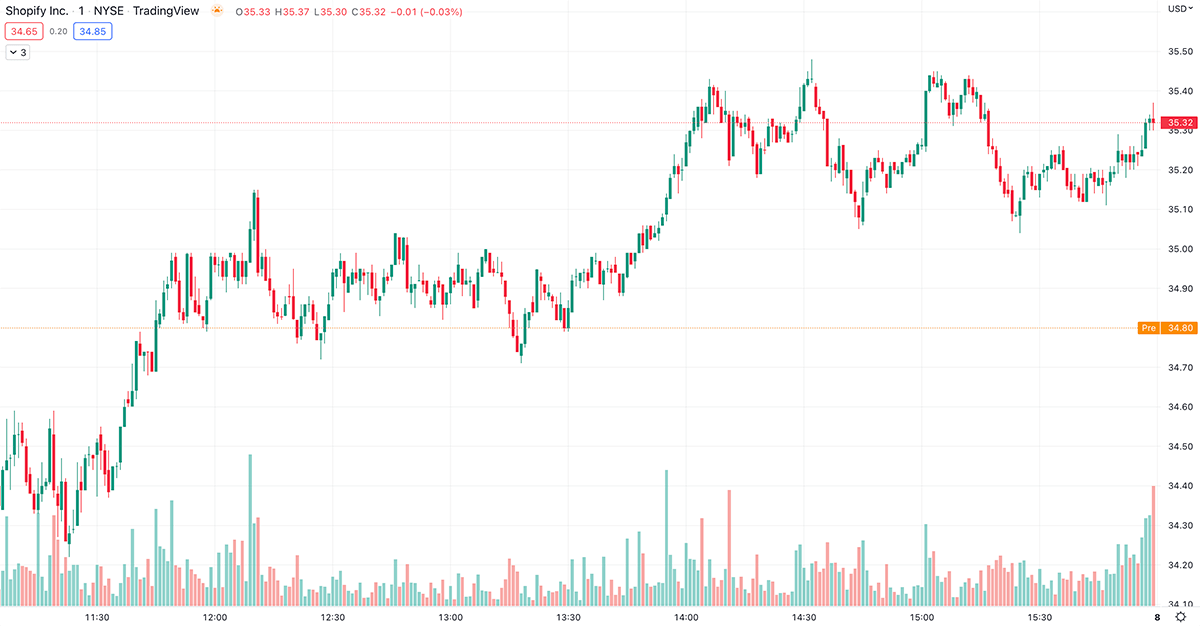
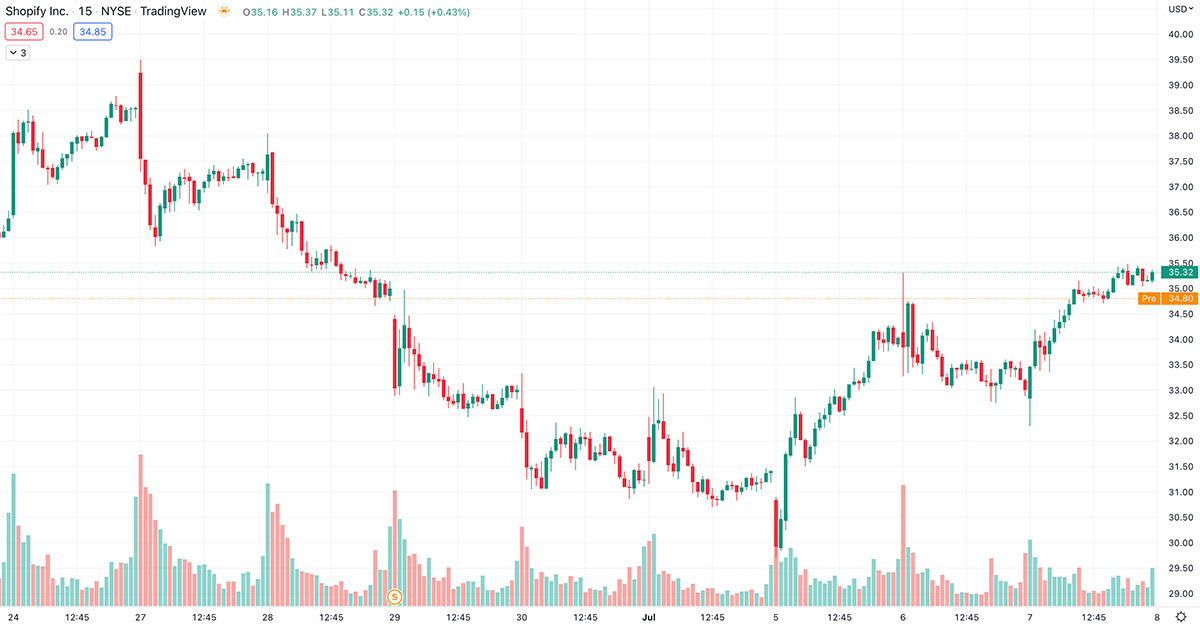
Here is Shopify where on the 1-minute chart things look like they are in an uptrend but on the 15-minute chart you can see it is in a downtrend.
Shopify 1 Minute Chart Trending Up
Shopify 15-Minute Chart Trending Down
Using Multiple Time Frames With Indicators
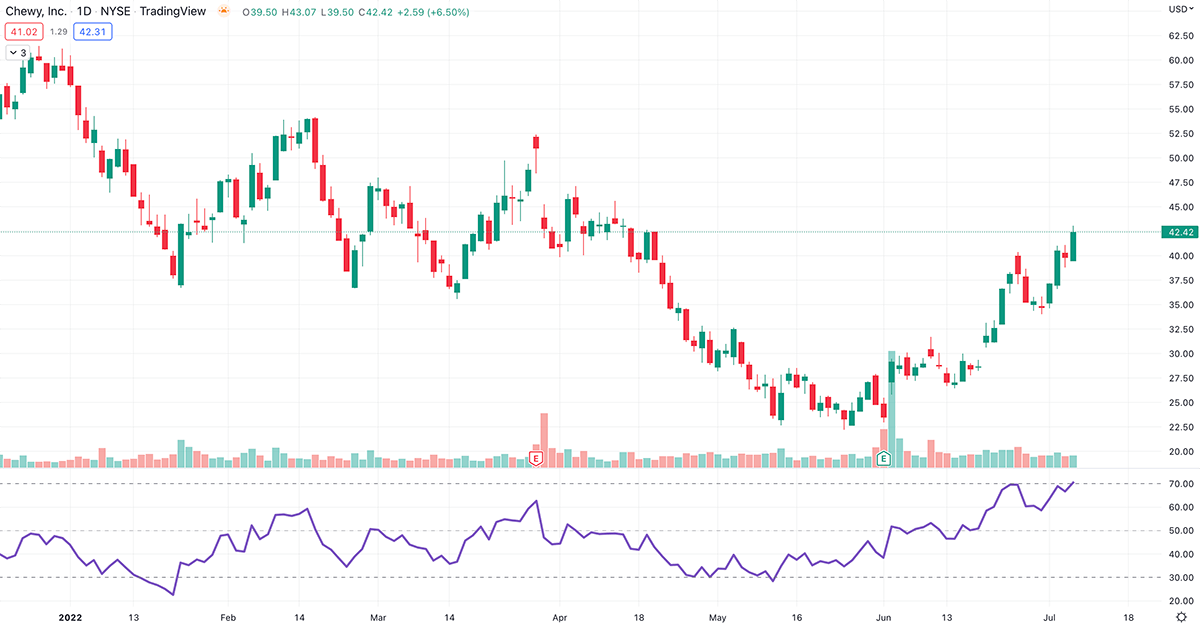
You can use multiple time frames to confirm indicators too so for example if RSI is showing over bought on the 5-minute chart but on the 1-hour chart it is oversold which could help you decide if it's a good trade to take. Here is Chewy where on the 1 Day chart rsi is overbought but on the 1-minute chart rsi is near the oversold line.
Chewy 1 Day RSI Chart Oversold
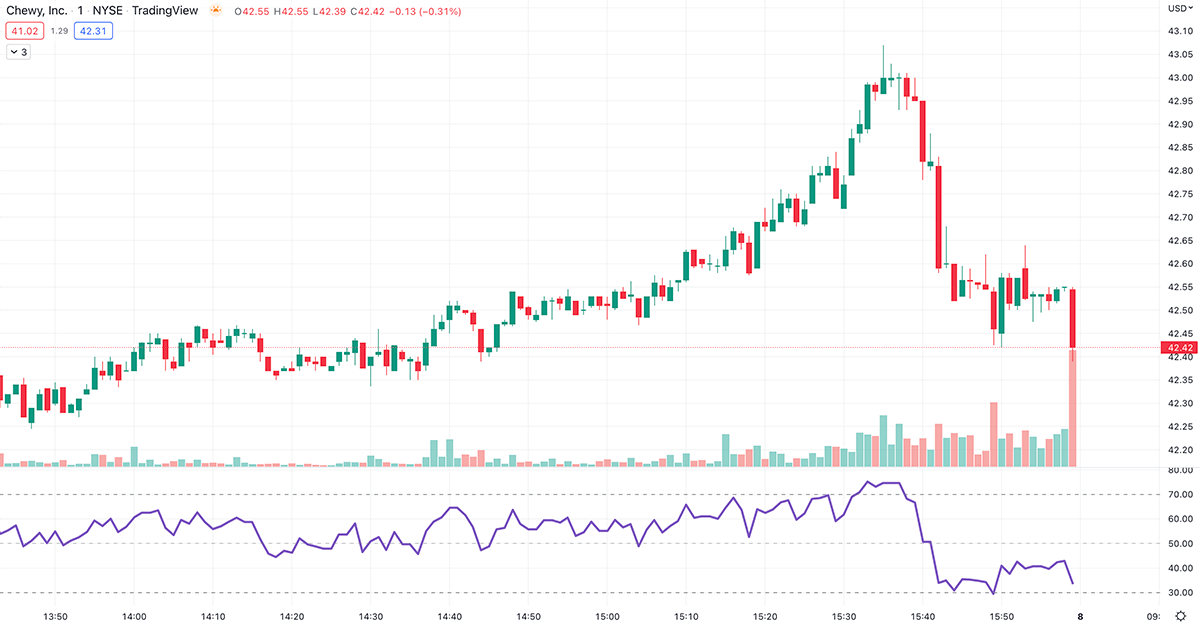
Chewy 1 Minute RSI Chart Overbought
Multiple time frames will allow you to see all the important support & resistance levels and the overall trend these are things you might miss if you are just using one time frame. Using a second time frame for confirmation is very important because it will allow you to make fewer mistakes and have a clearer picture of the market.