The Chaikin Oscillator A Simple Overview
The Chaikin Oscillator was developed by a stock analyst named Marc Chaikin in the late 20th century as a way to make informed decisions based on both price and volume data. He wanted to create an indicator that could capture the underlying buying and selling pressure in the market, providing a better way of understanding potential price movements.
How The Chaikin Oscillator Works
The Chaikin Oscillator is based on the premise that changes in price and volume are interrelated. The core principle behind the oscillator is that price movements accompanied by high trading volume are more likely to indicate genuine trends, while low volume may signify a lack of conviction or a temporary price movement. The Chaikin Oscillator seeks to identify these trends and potential reversals by taking the difference between the Accumulation/Distribution Line and its Exponential Moving Averages (EMAs).
The Accumulation/Distribution Line is an essential component of the Chaikin Oscillator, as it measures the flow of money into or out of a financial asset. It is calculated by comparing the closing price with the range between the high and low prices of a trading period. When the closing price is closer to the high, it suggests buying pressure, while a closing price near the low indicates selling pressure. By summing these values over time, the Accumulation/Distribution Line provides a cumulative measure of buying and selling pressure in the market.
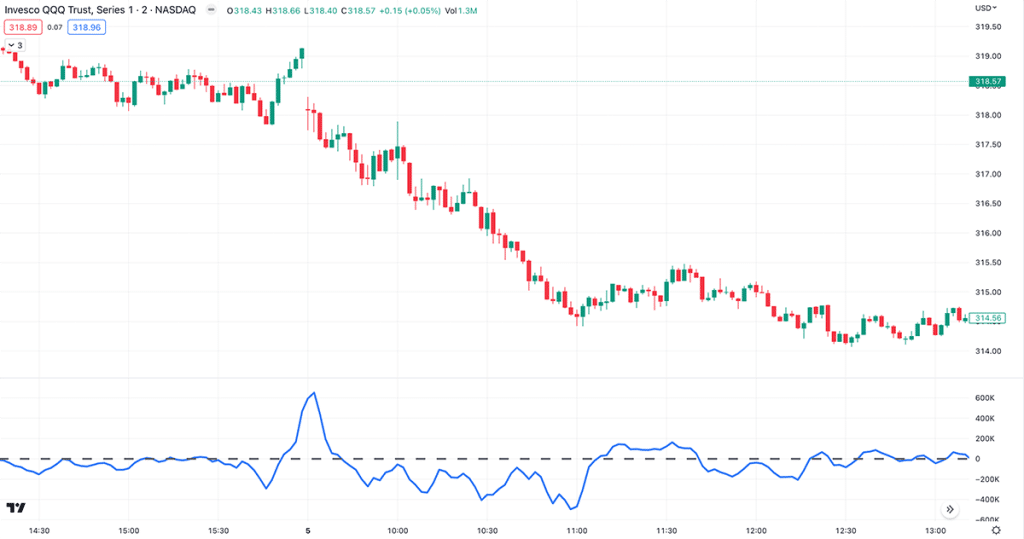
To calculate the Chaikin Oscillator, you need to find the difference between two Exponential Moving Averages of the Accumulation/Distribution Line, typically with 3-period and 10-period timeframes. The resulting oscillator values oscillate around a zero line, with positive values indicating bullish momentum and negative values pointing towards bearish momentum.
How To Trade With The Chaikin Oscillator
The Chaikin Oscillator offers you valuable insights into market trends, allowing you to capitalize on potential opportunities by identifying bullish and bearish trends. When the oscillator value is positive and rising, it indicates an uptrend, signaling that buying pressure is increasing.
Conversely, a negative and falling oscillator value suggests a downtrend, with selling pressure dominating the market. You can also look for divergences between the Chaikin Oscillator and price movements to confirm trends or predict potential reversals. For example, if the price is making higher highs while the oscillator is making lower highs, this bearish divergence may hint at an upcoming trend reversal.
To generate trade signals with the Chaikin Oscillator, you can watch for crossovers of the zero line, which often signify changes in market momentum. When the oscillator crosses above the zero line, it can be seen as a buy signal, while a cross below the zero line may be considered a sell signal.
It's crucial to set appropriate stop-loss and profit-taking points to manage risk effectively. Additionally, the Chaikin Oscillator can be combined with other technical indicators, such as moving averages or the Relative Strength Index (RSI), to create a more comprehensive and robust trading strategy. This holistic approach helps to filter out false signals and improve the overall effectiveness of your trades.
Advantages And Limitations
The Chaikin Oscillator offers several advantages, including its effectiveness in predicting price movements by combining price and volume data, flexibility to adapt to different timeframes, and applicability to various financial instruments. However, it's essential for you to be aware of its limitations as well. For instance, the Chaikin Oscillator can sometimes generate false signals, making it crucial for you to use additional technical analysis tools to confirm its readings. Additionally, the oscillator's effectiveness relies on accurate volume data, which may not always be readily available or reliable.
Conclusion
The Chaikin Oscillator is a powerful technical indicator that can provide valuable insights into market trends by combining both price and volume data. Helping you identify potential buying and selling opportunities, and confirm existing trends.