4 Best Trading Indicators to Identify the Trend
Identifying the trend is very important in trading. You don't want to be fighting the market and placing your trades when the strength of the market is moving in the direction opposite of your trade. Here are 4 different indicators that will help you do this.
Moving Averages
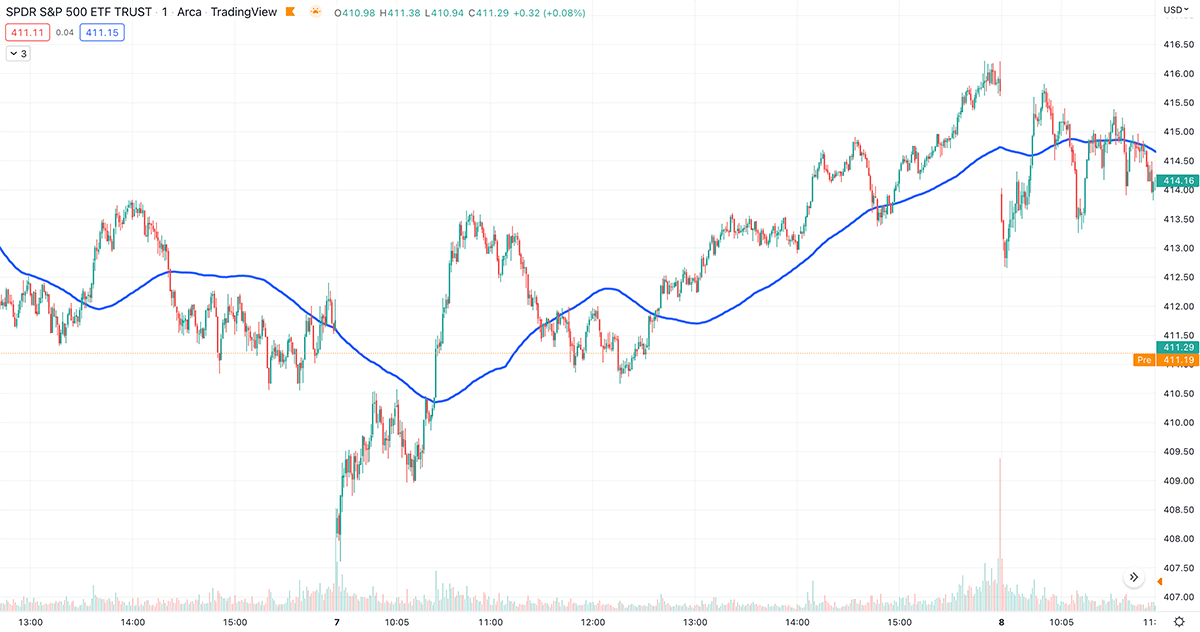
You can use a simple or exponential moving average to see the general direction of the trend. Popular moving average lengths are 50, 100 or 200 depending on how much of a long term trader you are. Here in the picture below is a 100 day moving average. You can see when the price has crossed above it and when the price has crossed below it. This will show you the trend based on the amount of length you have set it too. You can also use crossing moving averages like when the 50 day crosses the 100 day moving average. Moving averages are one of the easiest ways to get a quick look at what direction the price is trending in so that you don’t place your trades against the market.
Example of a 100 day moving average on the Spy Index.
MACD
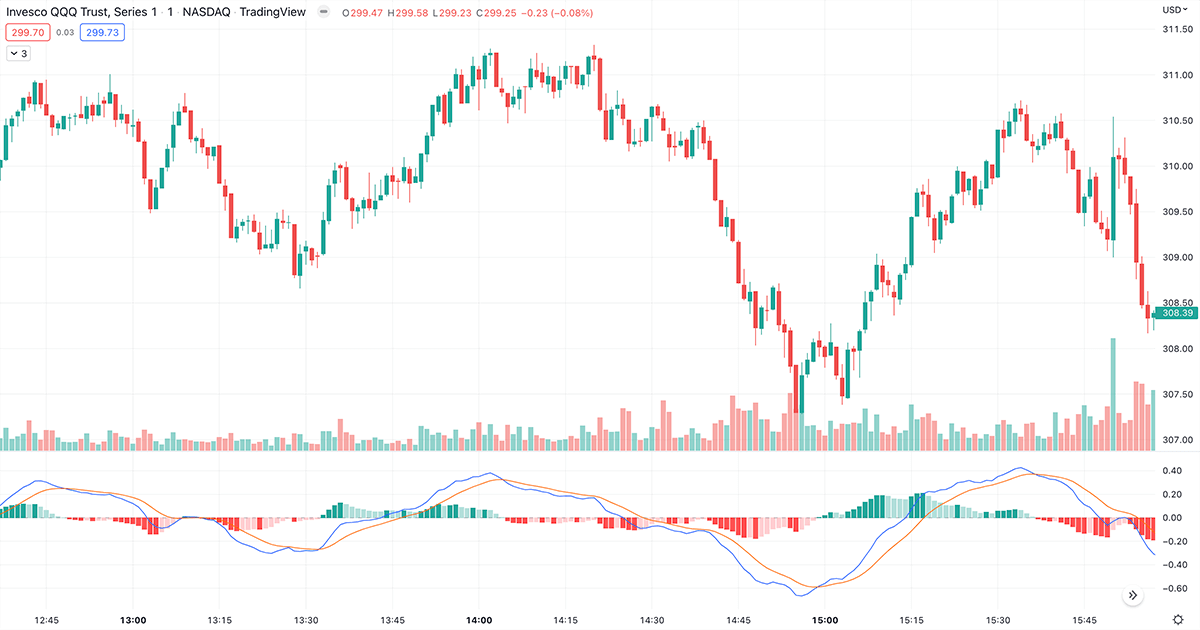
MacD Is another really popular indicator. If the MacD lines are above zero the stock is trending up and if the lines are below zero then it is trending down. There is also two lines on the MacD, the slow line and the fast line. When these two lines cross it can signal that the trend is changing. MacD also shows you the momentum and how strong it is.
Look at this example on the QQQ Index you can see where the two MacD lines cross each other and also see when they cross the zero line and how it moves with the stock price.
"Follow the Trend of the Market"
RSI
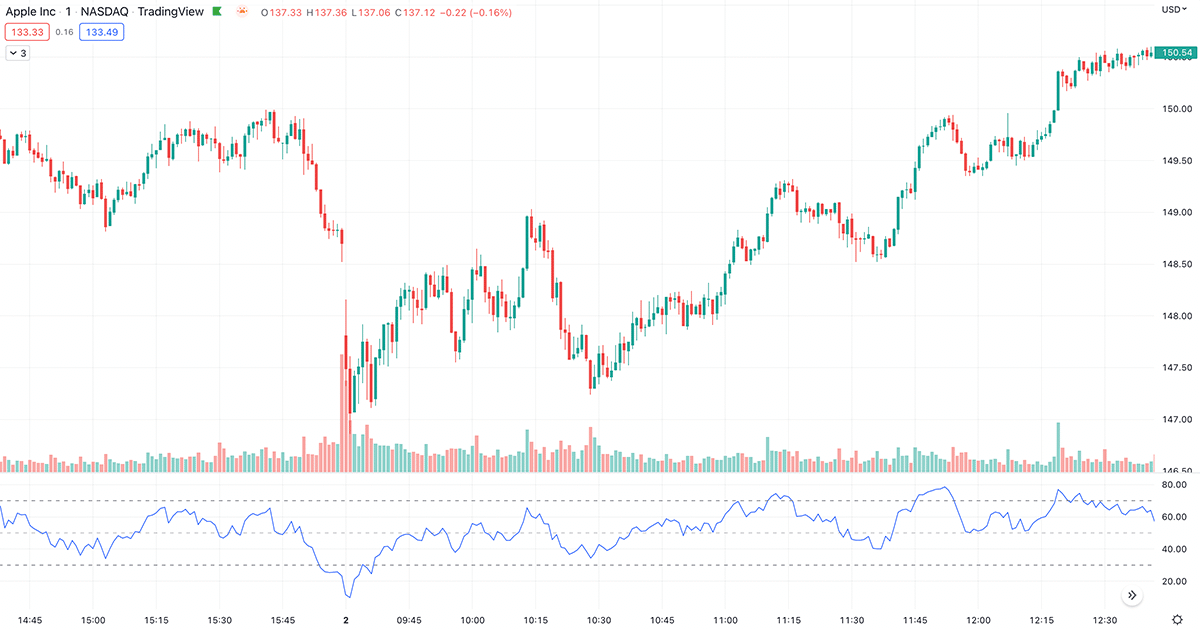
RSI can show you if a stock is overbought or oversold and it can show you when the trend is likely to change or if it is due for a pullback. If the RSI line is below 30 it is oversold and if it is above 70 it is overbought. Now you want to wait for confirmation because a stock can stay oversold or overbought for a long time before it goes in the other direction. So waiting for it to cross back over the 30 or 70 lines can be your confirmation. If you look at Apple stock in the chart below you can see where it is oversold and then starts trending up. You can use RSI to determine when a stock has sold off to hard or has been overbought.
On Balance Volume (OBV)
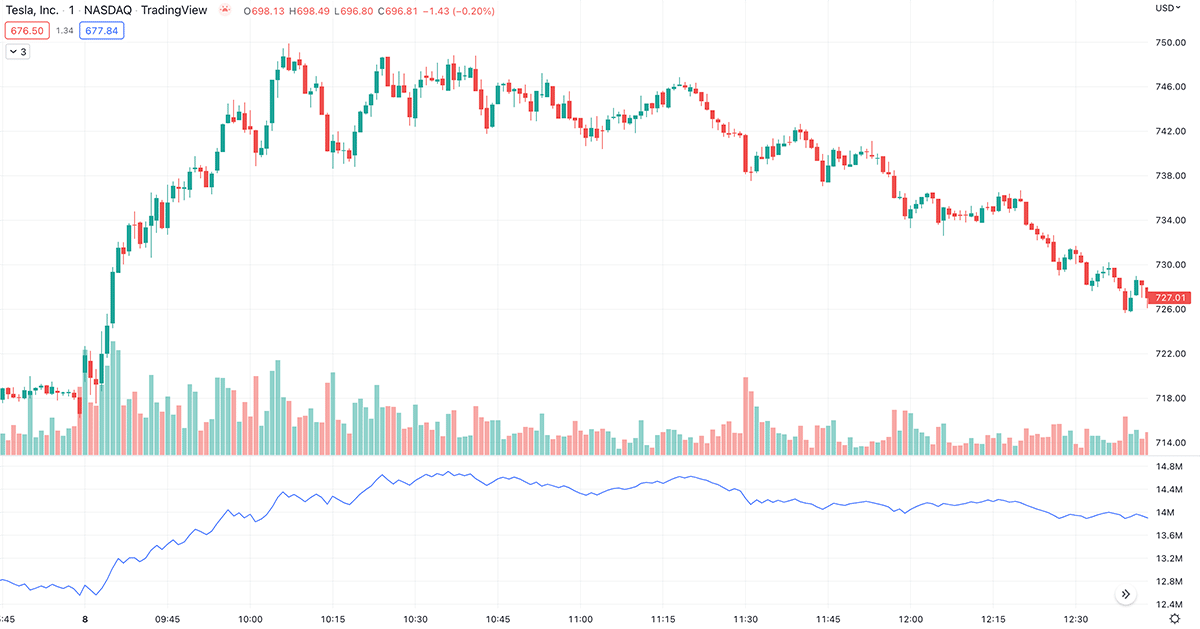
On Balance Volume Measures buying and selling pressure by adding together volume on up days and subtracting it from the volume on the down days. You want the price to be rising with OBV to show strength. If the price is rising and OBV is stalling or dropping that could be a sign that the trend is weakening. If you look at Tesla stock you can see that OBV has started to stall while the price started to go down. This is an early sign that the trend is reversing.
Conclusion
These are four of the most popular indicators to determine the direction of the trend. You can also combine multiple indicators to use as confirmation. Determining the direction of the trend is important and these indicators will help you do that.